Beware of fake job offers and payment requests. We only use official email IDs and never conduct interviews on messaging apps.Beware of fake job offers and payment requests. We only use official email IDs and never conduct interviews on messaging apps.
“Koenig’s requirements were clear and concise; they wanted tangible increases in visibility, traffic, engagement and brand recognition.”
The Client:
Established in 1993, Koenig is a leading name in the IT training industry across the globe. The company has won numerous accolades for its work in the form of prestigious titles like Oracle India’s Best Training Partner 2012, Best Contribution to Microsoft Learning 2012 and the most recent Limca Book of Records 2014 for being the Largest Offshore ITTraining Company.
The Target Market:
Koenig targets working IT professionals and fresh IT graduates from across the globe. Target areas are the U.S.A., the U.K., Europe, Africa, Middle East and Australia.
The Requirement:
Koenig engaged Techmagnate to manage their community on Facebook and quickly grow it into a thriving community that would help extend the brand and drive student registrations. They were looking at the following through their Social Advertising campaign:
Increased visibility with higher brand recognition.
Larger community with a substantially higher number of Page Likes.
Higher engagement on the content being posted on their community.
To increase the Facebook community by 500 likes per day, from the relevant audience. Given the Ad targeting options available, it would not be easy to identify IT professionals and graduates looking to enhance their skills. One could easily blow-up the advertising budget on the wrong audience.
The Solution:
We proposed utilizing targeted Facebook Ads through the sidebar and timeline (boosted) posts along with a steady stream of relevant, engaging content.
We identified several diverse communities of IT professionals from different parts of the world who we could target via their interests.
“The monthly social traffic from Facebook to Koenig’s website increased by 179% in April 2014 compared to Feb 2014.”
The Results:
The Social Ads campaign started in Feb. 2014. It took us a couple of months to identify and target the correct audience and build momentum. Once we did, the results were phenomenal:-
New Page Likes and Cost Per Like (CPL) for Koenig’s Facebook Campaign
Month
New Page Likes
Cost Per Like (Rs.)
Total Likes on Page
% Increase in monthly Facebook Traffic to Site compared to Feb. 2014
February 2014
6357
8.27
33895
0%
March 2014
4220
6.15
38115
49%
April 2014
25597
3.38
63712
179%
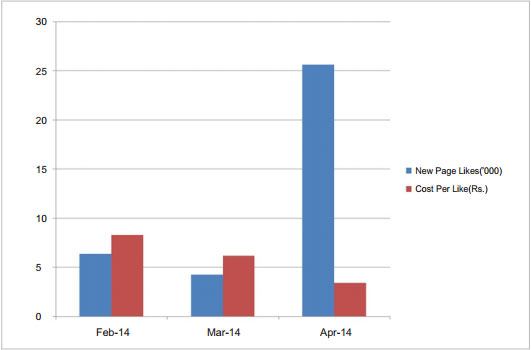
Graphical Representation: Page Like Increase vs. CPL Decrease
The Page Likes increased by more than 25,000 in April 2014 i.e. an average of 833 new likes per day; a number significantly higher than the target of 500 per day.
The Cost Per Like (CPL) of the Facebook campaign reduced by 62% from Rs. 8.27 in Feb. 2014 to Rs. 3.38 in April 2014.
The monthly social traffic from Facebook to the site increased by 179% in April 2014 compared to Feb 2014. This resulted in a whopping increase of almost 60% in assisted and direct conversions via Facebook.
Get the most valuable search related insights about leading brands, trending keywords, search volumes, fastest growing categories, city-level insights and much more!
It has come to our notice that fraudulent job offers are being circulated on the internet through messaging apps like WhatsApp and Telegram, which falsely claim to be from Techmagnate. We take this matter seriously and would like to caution all candidates to be wary of such postings.
Please Note That –
We do not charge any fees/security deposit/payment from candidates, irrespective of the professional experience they hold, for job applications or interviews
Official communication channels include our website and verified social media accounts, primarily LinkedIn.
Kindly double-check the domain name – @techmagnate.com – in the email address
We follow a transparent and ethical approach for hiring/onboarding supported by proper documentation.
Ensure that you only apply through verified channels to avoid being scammed. We also recommend that you exercise caution when sharing personal information or financial details with any job posting or recruitment agencies claiming to represent us.
We want to ensure that potential candidates interested in joining Techmagnate have a safe and positive experience.
If you find that someone that fits the description above has reached out to you, please notify us immediately at jobs@techmagnate.com.
 Important Alert: