Beware of fake job offers and payment requests. We only use official email IDs and never conduct interviews on messaging apps.Beware of fake job offers and payment requests. We only use official email IDs and never conduct interviews on messaging apps.
Summary: Google Analytics dashboards provide a customisable interface that helps visualise your website’s performance using multiple widgets and metrics. You can use it to compare reports, understand customer journeys, improve ROI for marketing spends and transform raw data into actionable insights.
Data is money in today’s world. Businesses that succeed today have a deep understanding of who is visiting their website, where they come from and how long they stay before leaving. This article is a Google Analytics dashboard guide on how you can gather, organise and analyse data for business success.
Key takeaways:-
Google Analytics is a fundamental tool that helps businesses track several key metrics like page views, bounce rate, location and more.
Google Analytics dashboards use graphs, charts, and other forms of data visualisation to tell you how a website performs with users.
Creating a new property and installing a tracking ID are important steps to building a Google Analytics dashboard
Using the principles of effective dashboard design can make data visualisations easier to watch and understand.
Traffic acquisition reports, landing page reports and organic page reports are just some of the Google Analytics dashboards available to you within the same property.
Table of Contents
What is Google Analytics Dashboards?
Google Analytics dashboards help businesses understand how their website is performing using charts, graphs and other forms of data visualisation. You can customize the digital interface and choose multiple widgets to track various metrics. Some metrics tracked most frequently are:
You can choose up to 12 widgets for every dashboard that allows you to track the marketing analytics your business or campaign values the most. Using Google Analytics dashboards is a great way to evaluate your website’s performance, monitor business performance and compare data reports.
Discover What Your Customers Search ForDiscover What Your Customers Search For
Get insights on evolving customer behaviour, high volume keywords, search trends, and more.
Besides being easy to share, there are several benefits of using Google Analytics dashboards.
1. Streamlined data analysis
You no longer need to download or create the same report once every week. Simply create the report using a Google Analytics dashboard and monitor it as often as you need to. Businesses can also track GA4 metric performance through marketing analytics insights and data visualisation.
2. Customisation possibilities
You can deep dive into data and metrics that are more important for your business or a specific campaign. You don’t need to rely on readymade dashboards or reports that Google Analytics creates.
3. Real-time insights
Features like real-time visitor counters and other data trackers give you immediate access to all necessary campaign metrics. This will tell you if you should diversify the platforms you are using to drive traffic to your website, such as Google Maps ads or social media marketing.
How to Build a Google Analytics Dashboard
Setting up an account for Google Analytics is a fairly simple process if you follow a few simple steps.
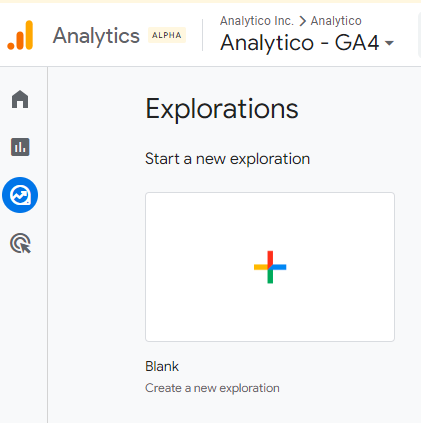
Step 1: Log in to Google Analytics. Go to the ‘Reports’ and click on Explore.
Step 2: Create a new dashboard by clicking ‘Blank’.
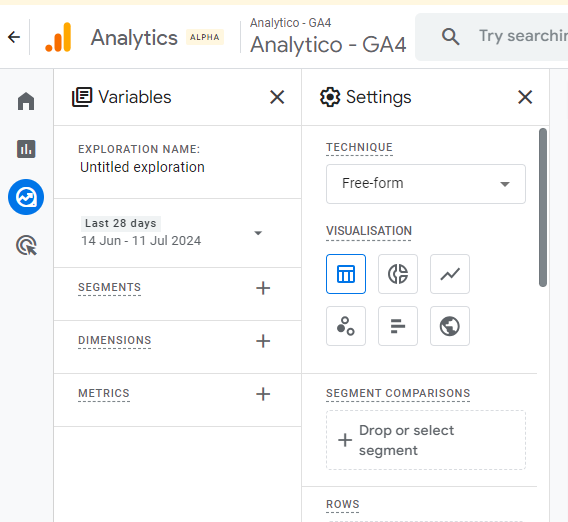
Step 3: Add the relevant data to your dashboard. Click ‘Variables’ and select the necessary GA4 metrics and dimensions. Drag and drop them in ‘Tab Settings’ and configure your data visualisations.
Step 4: Customise your visualisations with widgets. Add different types of graphs, data charts and scatter plots to your dashboards. Once this is done, customise every chart using relevant metrics and dimensions, and also adjust segments, date ranges and filters.
Step 5: Save and share your dashboard using the ‘Save’ button. You can also share this dashboard with your team using the ‘Share’ button.
Step 6: Monitor your dashboards regularly to identify trends and key metrics. Use the insights you find to optimise your existing marketing strategies and GA4 setup.
How to Share and Import Dashboards
Sharing an existing dashboard allows easy collaboration between teams and vendors. To share your Google Analytics dashboard, take the following steps.
Open the dashboard in question.
Click ‘Share’ at the top right corner
Enter the email addresses necessary and the permissions they will need
Click ‘Send’.
If you are trying to import a dashboard,
Open the dashboards section.
Click ‘Create’ and then ‘Import from gallery’.
Browse through existing dashboards or enter the URL necessary.
Click ‘Import’.
Tips for Optimising Dashboard Design and Visualisation
1. Keep it simple and intuitive.
A dashboard needs to be easy to use and understand, even for IT experts. It is important to keep your design minimalistic because the information and data must be clear from the start.
2. Use design elements consistently.
A visually appealing Google Analytics dashboard always has consistent design elements. Make sure you choose icons and colours that work well together and keep them consistent throughout the dashboard design. Don’t forget to match this with your website’s or app’s aesthetic.
3. Prioritise key data.
When you ensure critical data shows up first and more prominently, it quickens decision-making for businesses. Organise the data and give options to the user to switch between all the key metrics necessary. Also, use KPI cards so that viewers know what to search for or look at.
4. Make the data visualisations responsive.
Your stakeholders will view your data across multiple devices, either at the same time or separately. Make sure your design adapts to various screen sizes without compromising on functionality. A responsive design requires a flexible grid system that enables easier content reordering and resizing.
How to Share a Google Analytics Dashboard in GA 4 – Step-by-step Tutorial
Method 1 – Export the report to CSV or PDF format:
From the snapshot in Reports, click ‘Share’ and then ‘Download File’. This is the simplest method, but as an analyst, this requires a lot more work. You still need to analyse the raw data, format it and then ensure ample context to make this data useful for your stakeholders.
Pros: This method is straightforward and requires less effort and can be sent through any messaging platform or email.
Cons: CSV and PDF files are static file formats. This means data doesn’t update itself in real time. Such raw data exports are not ready to present to clients and require work using Google Sheets or MS Excel before it is presentable or even relevant to stakeholders or clients.
Method 2 – Share a link in Google Analytics:
Provide the necessary permissions to all the people you wish to give access to.
If you wish to share the link to your dashboard template, click the share button on the top right corner of your report. Finally, click on ‘Share Link’ to create the shareable link. Since transitioning to Google Analytics 4 in 2023, UA (Universal Analytics) properties stopped processing new hits on the previous versions, after 1st July 2023.
Pros: This method makes it easy to share the report multiple times. The dashboard also updates itself in real time.
Cons: There are several drawbacks of this method.
You cannot contextualise or annotate the data shared through this link.
This shareability only covers data within Google Analytics 4 dashboards. If you wish to review other tools’ data, you will have to export data from other tools or find a way to combine the dashboards.
The visual data customisation options are limited.
5 Metrics to Include in a Google Analytics Dashboard
A well-structured Google Analytics Dashboard gives you a quick snapshot of your website’s performance. To make the most of your dashboard, it’s important to focus on key metrics that reflect user behavior, engagement, and conversion trends. Here are five essential metrics to include:
Users & Sessions – Track how many people visit your site and how often. This gives an overall view of traffic trends and audience interest.
Bounce Rate or Engagement Rate – Understand how engaged users are by monitoring how quickly they leave or how long they stay.
Traffic Sources – Identify where your visitors are coming from—organic search, social, direct, or paid campaigns.
Goal Completions or Conversions – Measure how well your site drives desired actions like form submissions, purchases, or sign-ups.
Top Pages by Views – See which content performs best to optimize for what’s working and improve underperforming pages.
Top 5 Google Analytics 4 Dashboards with Examples
Google Analytics 4 has several pre-built data reports and templates that are already populated with data. In case you feel overwhelmed with the interface and other details on the platform, these reports come in handy. They are a strong starting point, and with a few filters and customised widgets, you can deep dive into multiple specific metrics.
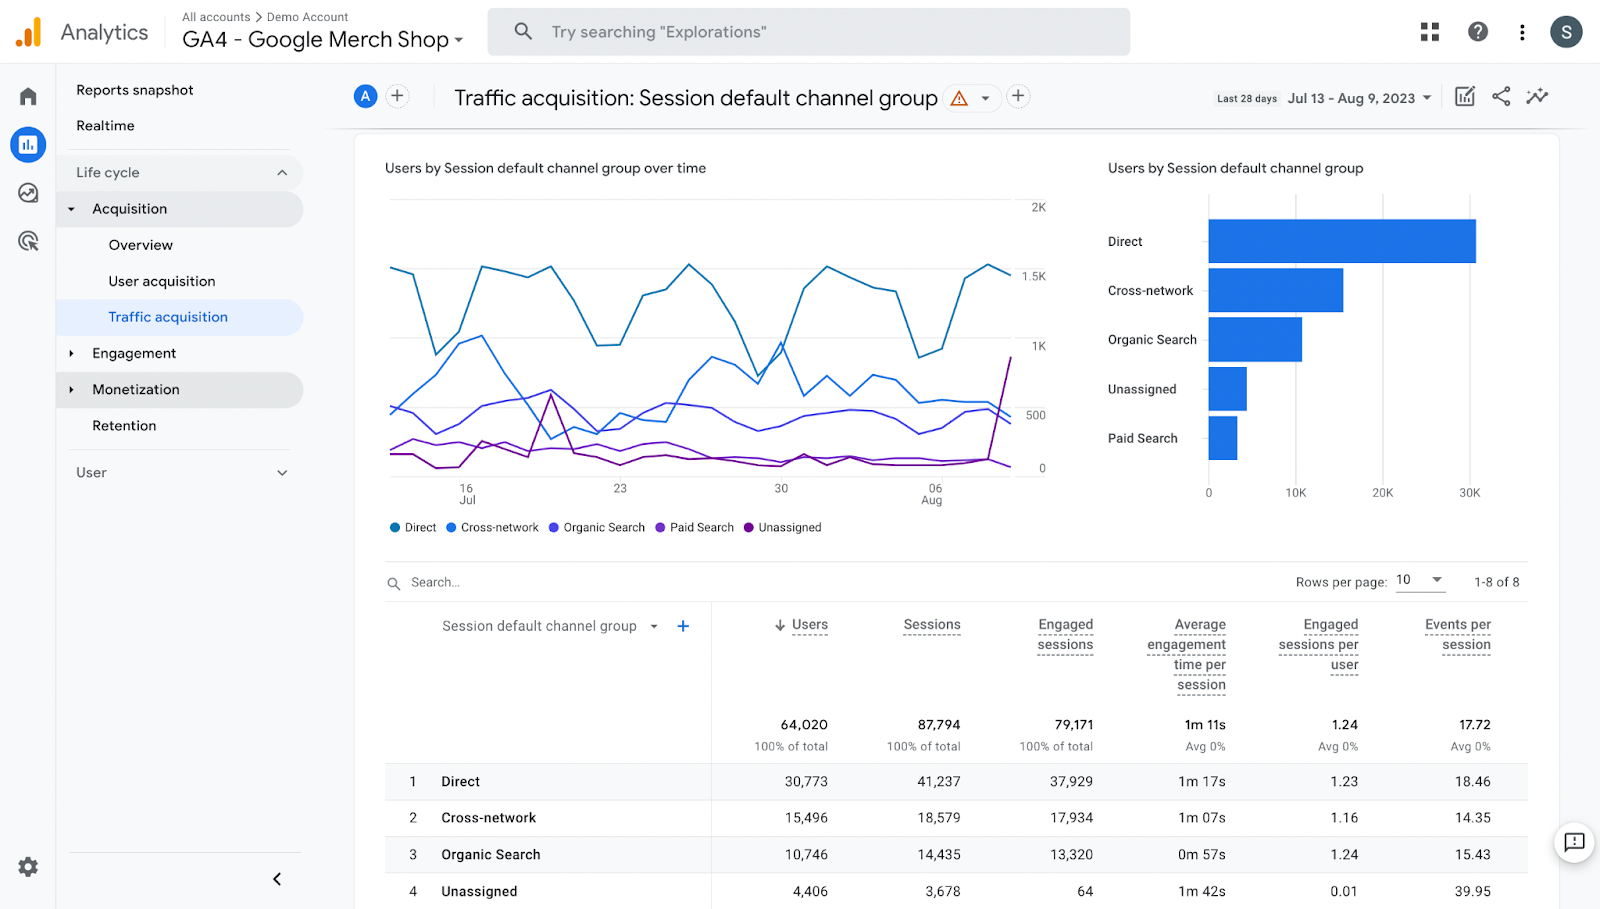
1. Traffic acquisition report
This report offers deep insights into who is visiting your website, how long they stay, where they come from and whether they convert or not. Analysing this data can help you identify your heaviest traffic sources in terms of engagement and visitor quality. Additionally, it helps detect Unassigned Traffic in Google Analytics, which may result from missing UTM parameters, improper tracking configurations, or direct visits. You can also use other Google Analytics 4 dashboard displays to get a fixed view of your performance.
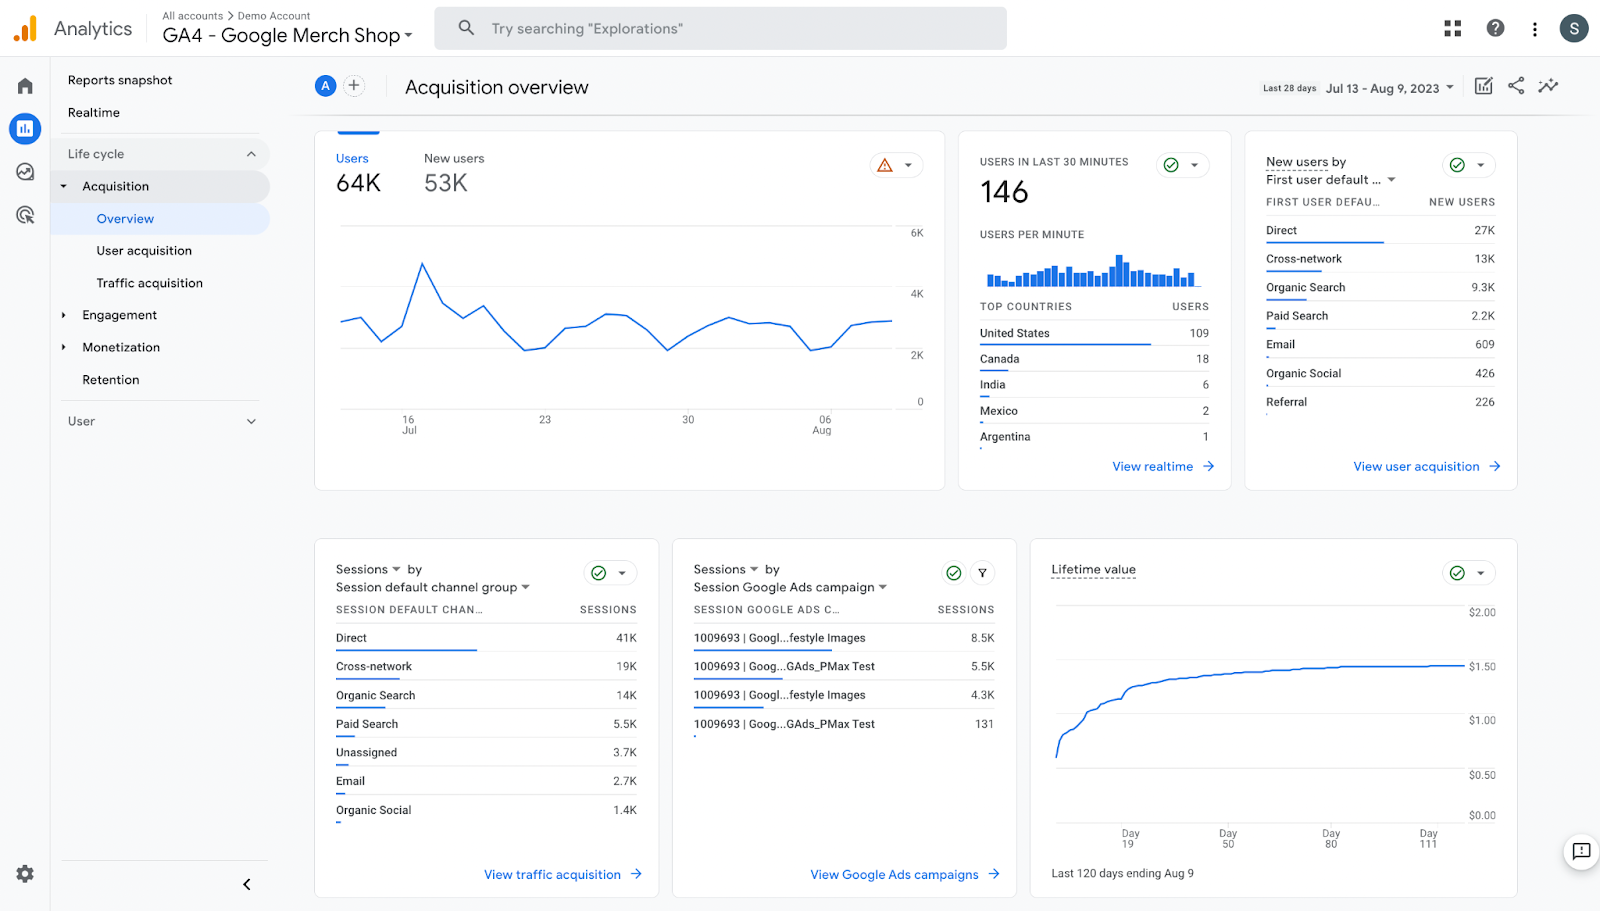
2. Acquisition overview report
Account and marketing executives stand to gain the most from this report. The Acquisition Overview Report provides a high-level snapshot of key metrics, including new user acquisition, customer lifetime value (CLV), traffic sources, and the effectiveness of Google Maps Ads. These insights help in making data-driven decisions by identifying trends in user acquisition and engagement.
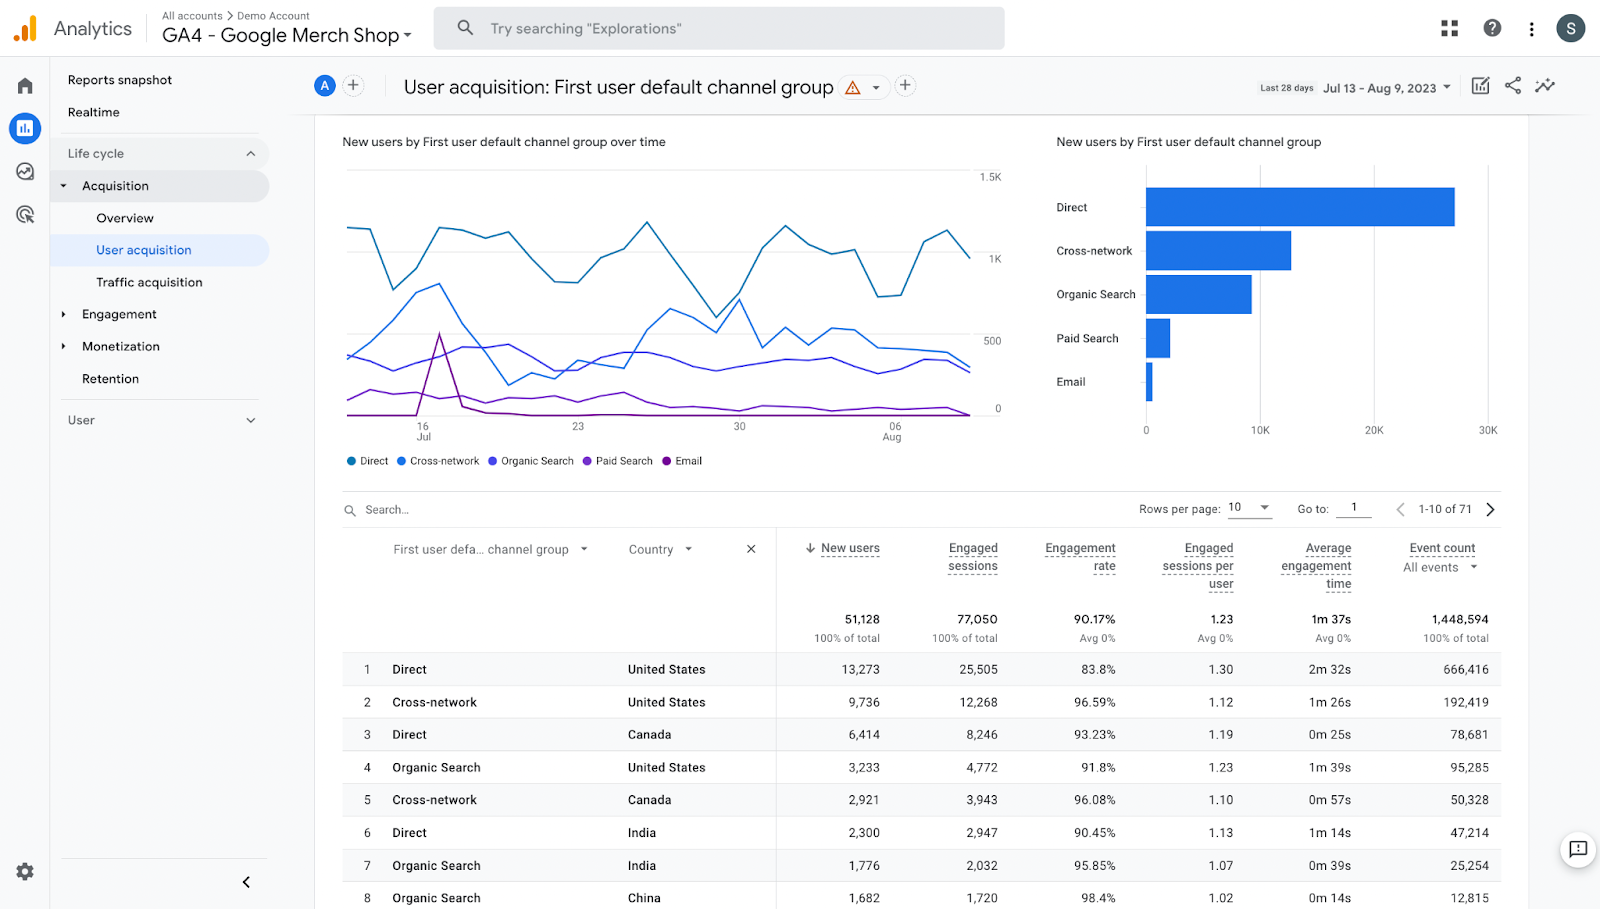
3. User acquisition report
For a deeper understanding of audience insights, the User Acquisition Report within Google Analytics 4 is essential. This report allows you to see which traffic sources drive the most users, how many users convert to customers, and how long they engage with your website. Additionally, it provides a key advantage by incorporating event count data alongside new insights such as device type, gender, and country, all accessible through summary cards within the custom dashboard report.
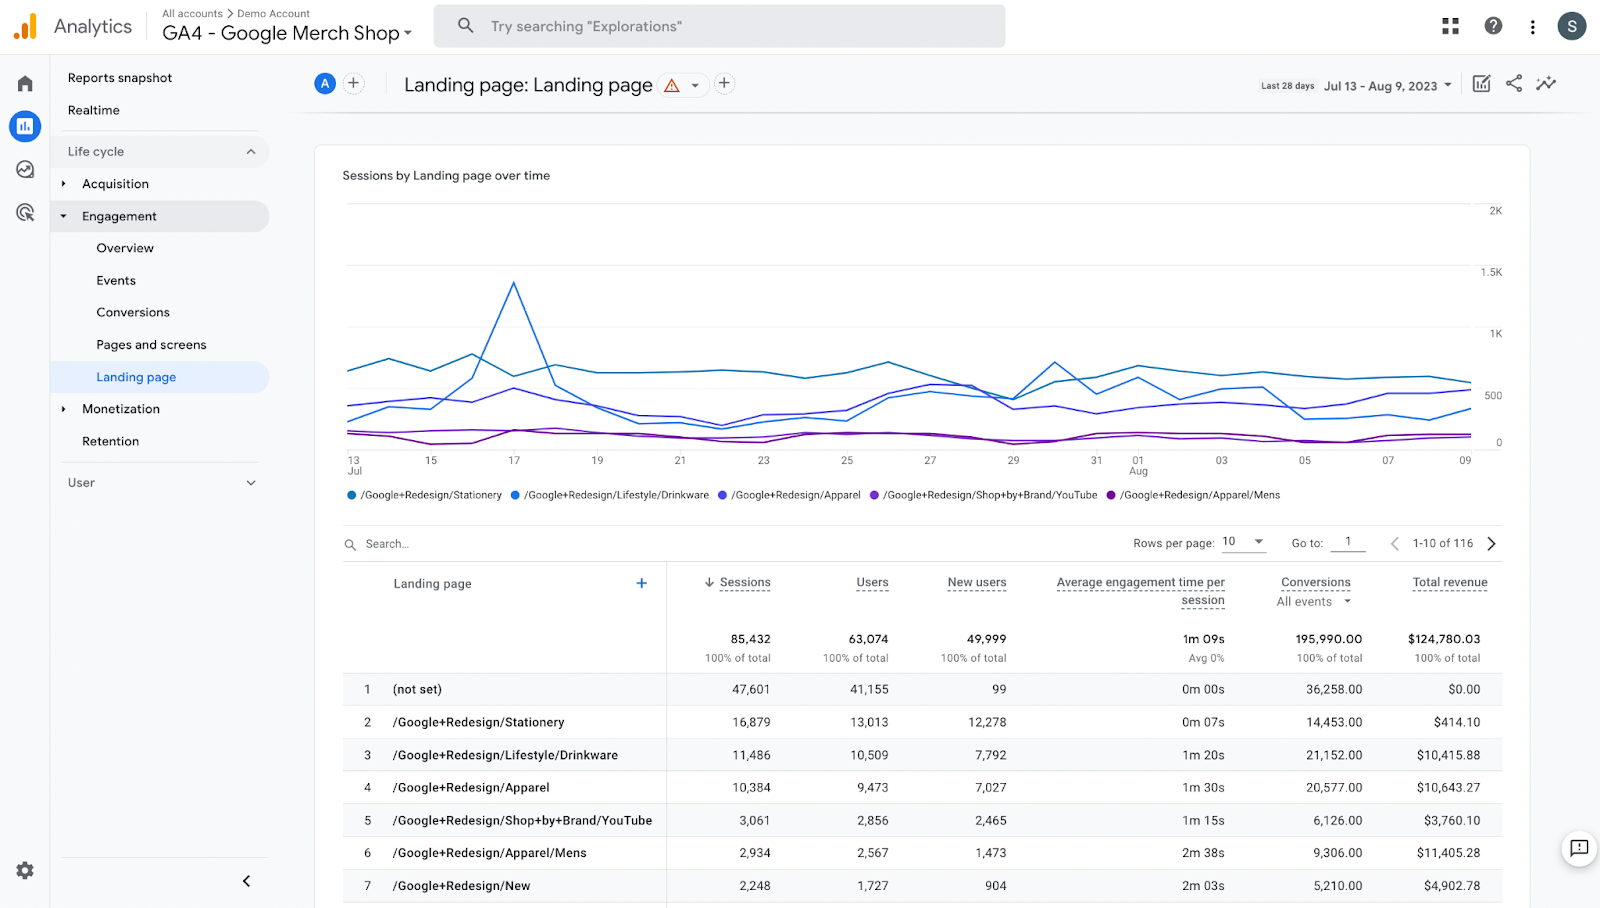
4. Landing page report
The landing page report is the best resource to measure website metrics using Google Analytics dashboards. It showcases a website’s best-performing pages using metrics like engagement, sessions, total revenue and goal conversions. When you monitor this dashboard, you can pinpoint the pages that are most effective when it comes to driving user engagement and conversions as well as which pages need to be optimised.
5. Organic search acquisition report
SEO takes a while to show results. This means you need to revisit web pages regularly to ensure traffic and conversions are consistent or growing. Using an organic search acquisition dashboard lets businesses monitor SEO efforts and understand which content ranks better and whether it drives quality visitors to the website or not.
Conclusion
Google Analytics Dashboards offer a powerful way to visualize, monitor, and analyze your website or app data in real time. Whether you’re tracking user behavior, conversions, or traffic sources, dashboards simplify complex metrics into actionable insights. By setting up custom dashboards tailored to your business goals, you can make smarter, data-driven decisions. If you’re looking to maximize the value of your dashboards or need help with advanced configurations, consider professional GA4 Consulting Services to ensure accurate tracking and strategic implementation. With the right support, you can unlock the full potential of GA4 and drive meaningful growth.
Neha Bawa is the Director of Brand Marketing at Techmagnate. She has worked in Digital Marketing since 2012 and has specialised in content creation. She has earned a Master’s degree in Interactive Communications from Quinnipiac University in Connecticut, U.S.A. Her interests lie in creating great content, docs, and working towards sustainability through biodiversity.
Get the most valuable search related insights about leading brands, trending keywords, search volumes, fastest growing categories, city-level insights and much more!
It has come to our notice that fraudulent job offers are being circulated on the internet through messaging apps like WhatsApp and Telegram, which falsely claim to be from Techmagnate. We take this matter seriously and would like to caution all candidates to be wary of such postings.
Please Note That –
We do not charge any fees/security deposit/payment from candidates, irrespective of the professional experience they hold, for job applications or interviews
Official communication channels include our website and verified social media accounts, primarily LinkedIn.
Kindly double-check the domain name – @techmagnate.com – in the email address
We follow a transparent and ethical approach for hiring/onboarding supported by proper documentation.
Ensure that you only apply through verified channels to avoid being scammed. We also recommend that you exercise caution when sharing personal information or financial details with any job posting or recruitment agencies claiming to represent us.
We want to ensure that potential candidates interested in joining Techmagnate have a safe and positive experience.
If you find that someone that fits the description above has reached out to you, please notify us immediately at jobs@techmagnate.com.
 Important Alert: